

Rae Neville
“A map does not just chart, it unlocks and formulates meaning; it forms bridges between here and there, between disparate ideas that we did not know were previously connected.”
– Reif Larsen, The Selected Works of T.S. Spivet
Mapping and other forms of digital visualization offer unique opportunities to academics wishing to make their work more accessible to the public. As a historian with extensive creative and design experience, I have always sought ways to bridge the gap between academic research and creative projects. Some of these projects include a podcast about a seventeenth-century witch trial, a video game about Sogdian traders on the Silk Road, and a historical novel (a work in progress). Last semester I had the opportunity to take a class about mapping historical sites in Washington, D.C. using ArcGIS StoryMaps. You can see the results of the project by clicking here. Using newspaper archives, personal accounts, and other primary sources, I mapped out sites in D.C. visited by Carlos Romulo during World War II.
I had first encountered Carlos Romulo in an assigned reading about U.S. history in another class; although he was only briefly mentioned, his story stuck with me and I decided to do further research. My father spent much of his formative years living in the Philippines in the 80s and90s and I have grown up with stories about his family’s time there. This may be one of the reasons I was drawn towards a topic that highlighted U.S.-Philippines relations during the war period. Pursuing this topic was one way I could connect with my family history and the global events that led to them living in the Philippines. Romulo is well-known for many reasons. He started as a journalist in the pre-war period, for which he received a Pulitzer Prize, and during the war, he toured almost 500 locations in the States to highlight the war’s impact on the Philippines. After the war, Romulo went on to work with the United Nations and more. For this project, I sought to understand and highlight his activities in Washington, D.C. between 1942 and 1945.
The Project
Like any research project, I began by defining my time constraints, identifying my questions, and hunting for primary sources. I wanted to understand what Romulo did in D.C. during the war, his impact, and his perspective on his activities. This gave me a set time period to narrow my search down to as I could only limit myself to newspaper articles from between June 1942 (with his arrival in the U.S.) and February 1945 (with his return to the Philippines and the restoration of the Philippine government). With those parameters set, I began my search using the Library of Congress’ database of digitized newspapers: Chronicling America. It was long and tedious work that required locating articles that mentioned his name, then cross-referencing any addresses or building names to find sites in D.C. Finally, I was able to identify and locate approximately 20 significant sites visited by Romulo.
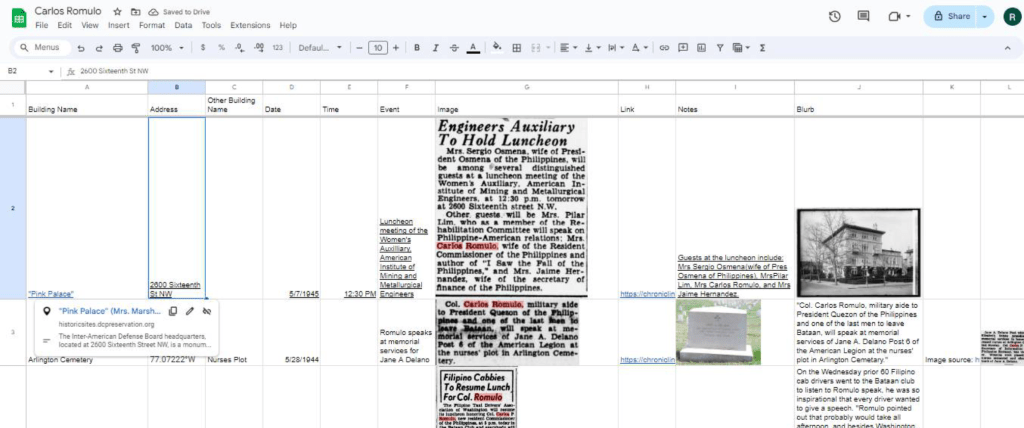
During my research, I cataloged and contextualized the sites within the broader story of Romulo’s nation-wide tour. I used Google Sheets to keep track of addresses, building titles, images, newspaper articles, source information, and relevant quotes and contextual information from Romulo’s writings.
Once I had all of my sites documented and organized, I was ready to start plugging the information into StoryMaps. StoryMaps is part of the ArchGIS suite of tools, and is an intuitive mapping tool that allows you to make custom maps that tell a story. Since I wanted the focus of my project to be more on telling Romulo’s story than on the map itself, StoryMaps was the perfect tool to use. It allowed me to make a simple website that allows users to navigate through the 20 sites, directly linking out to newspaper articles and images that could contextualize the story. Using this tool I was able to customize the look and order of the map (See Image 2). I had the flexibility to order the sites by date, while still giving users the option to navigate spatially.

Conclusion
Mapping and other data visualization tools provide unique ways to bring histories to life. It would have been possible to tell Romulo’s story without using StoryMaps, but offering a way for the reader to see the spread of his visits along with images, newspaper articles, and in some cases videos from the documented events, allows the reader to gain a deeper understanding of the story. In addition to making this history more accessible to a broad audience, this project also allowed me to merge academic research with creativity. As the opening quote states, “A map does not just chart, it unlocks and formulates meaning; it forms bridges between here and there, between disparate ideas that we did not know were previously connected.” This is true for history as well. Data visualization and creative research projects can help us and our readers bridge the gap between the present and the past.
Image: Andrew Neel, Pexels
Rae is a first-year graduate student in the MAGIC program. They graduated in 2020 with their BA in History from Berea College in Kentucky and have been in DC since July of this year. They came to Georgetown to research prostitution’s relationship to power dynamics in the 19th century.
